
In production, the bugs you see with AI agents are rarely in the model. The agent picks the right tool and calls it, but the tool usually fails for multiple reasons: auth, rate limits, bad requests, etc.
Your tracing usually cannot detect it. You see that the agent called update_deal and received an error. You do not see the full details of what exactly happened.
OpenTelemetry (OTel) is a standard most teams already use to trace everything else they run. And it works the same way for an agent: emit traces to a backend like Grafana, Datadog, or Honeycomb and read one agent run in-line with the rest of your stack.
This post covers the right way to implement OTel with agents so you have visibility into the integration side and the API calls behind each tool.
What OpenTelemetry gives you for AI agent observability
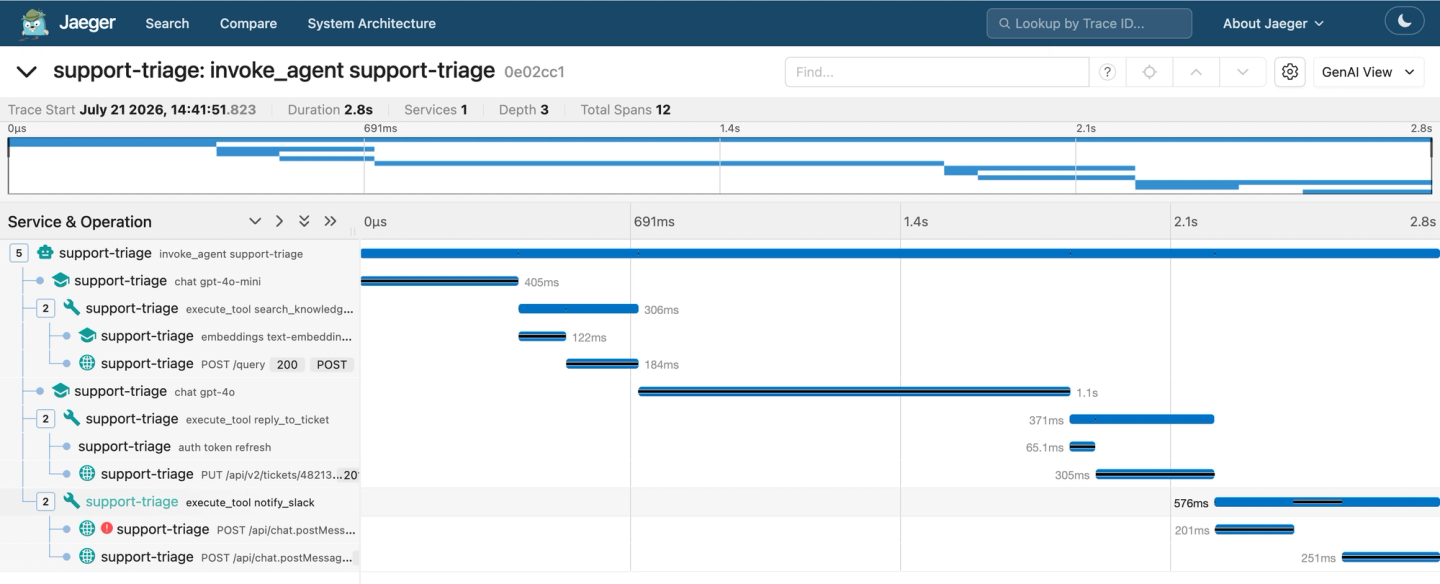
An AI agent run is not a single call. It touches your model provider, the tools the agent picks, and the external APIs behind those tools. OpenTelemetry traces that whole run as a set of connected events. You can follow one request from the prompt to the API call and back.
To make that portable, OpenTelemetry has the GenAI semantic conventions:
invoke_agent: one full agent run, the top of the trace.chat: one call to the model, where the agent reasons and picks a tool.execute_tool: one tool call the agent makes.
Each of these carries useful attributes: the model and provider, input and output token counts, the tool name, duration, and error status.
What you can capture today
Once your agent emits those spans, a single run gives you a trace you can act on:
- Token cost:
gen_ai.usage.input_tokensandgen_ai.usage.output_tokenson eachchatspan tell you what a run costs and which step is expensive. - Model and provider:
gen_ai.request.modelandgen_ai.provider.nameshow exactly what ran. - Tool selection and outcome: each
execute_toolspan carries the tool name, its duration, and itserror.typeif it failed, so you can see which tools the agent picks and how often each one succeeds.
Prompts, completions, and tool arguments are not captured by default because message content routinely contains customer data and PII.
OpenTelemetry for agent API integrations
The GenAI conventions cover the model and tool-selection layer well, but they stop at the tool boundary. The execute_tool span records that a tool ran and whether it returned an error. It does not describe what the tool does once it starts: the OAuth token it uses, the third-party HTTP request it makes, retries, rate-limit handling, pagination, or an incoming webhook.
To have full visibility, you’ll need to combine the GenAI OpenTelemetry conventions with the pre-existing HTTP client ones:
| Layer | Captured by the GenAI conventions | You add |
|---|---|---|
| Model call (`chat`) | Yes: model, tokens, finish reason | None |
| Tool selection (`execute_tool`) | Yes: tool name, duration, error status | None |
| The API call the tool makes | No | HTTP span (method, host, status) |
| Auth and token refresh | No | Auth span |
| Retries and rate limits | No | Retry and backoff spans |
| Incoming webhooks | No | Webhook span |
Most agent incidents in production happen in the integration layer, during the tool call:
- An expired connection. A customer resets their password, the OAuth refresh token is revoked, and every
create_notetool call fails auth. With the tool span alone you see five identical failed calls and wasted tokens. With an auth span underneath, you see the cause directly: the token refresh returnedinvalid_grant, so every retry failed the same way. - A rate limit that looks like a slow agent. A tool call reports success but takes three seconds, and users say the agent is sluggish. An HTTP span shows what actually happened: the first request got a
429, the integration backed off, and the retry succeeded. The problem is API capacity and backoff, and no prompt change will fix it. - A webhook that never arrived. An event-driven agent should react to a closed deal or a failed payment. When the webhook does not arrive, a model-only trace has nothing to show, because the failure was in the delivery path. A webhook span, tied to the connection it belongs to, shows that the event for that customer was never received, instead of leaving you to guess why the agent stayed idle.
You do not replace OpenTelemetry for this. You extend the same trace: the HTTP call, auth, and retries become child spans of execute_tool, so one run, from the agent’s decision to the API response, sits in a single trace.
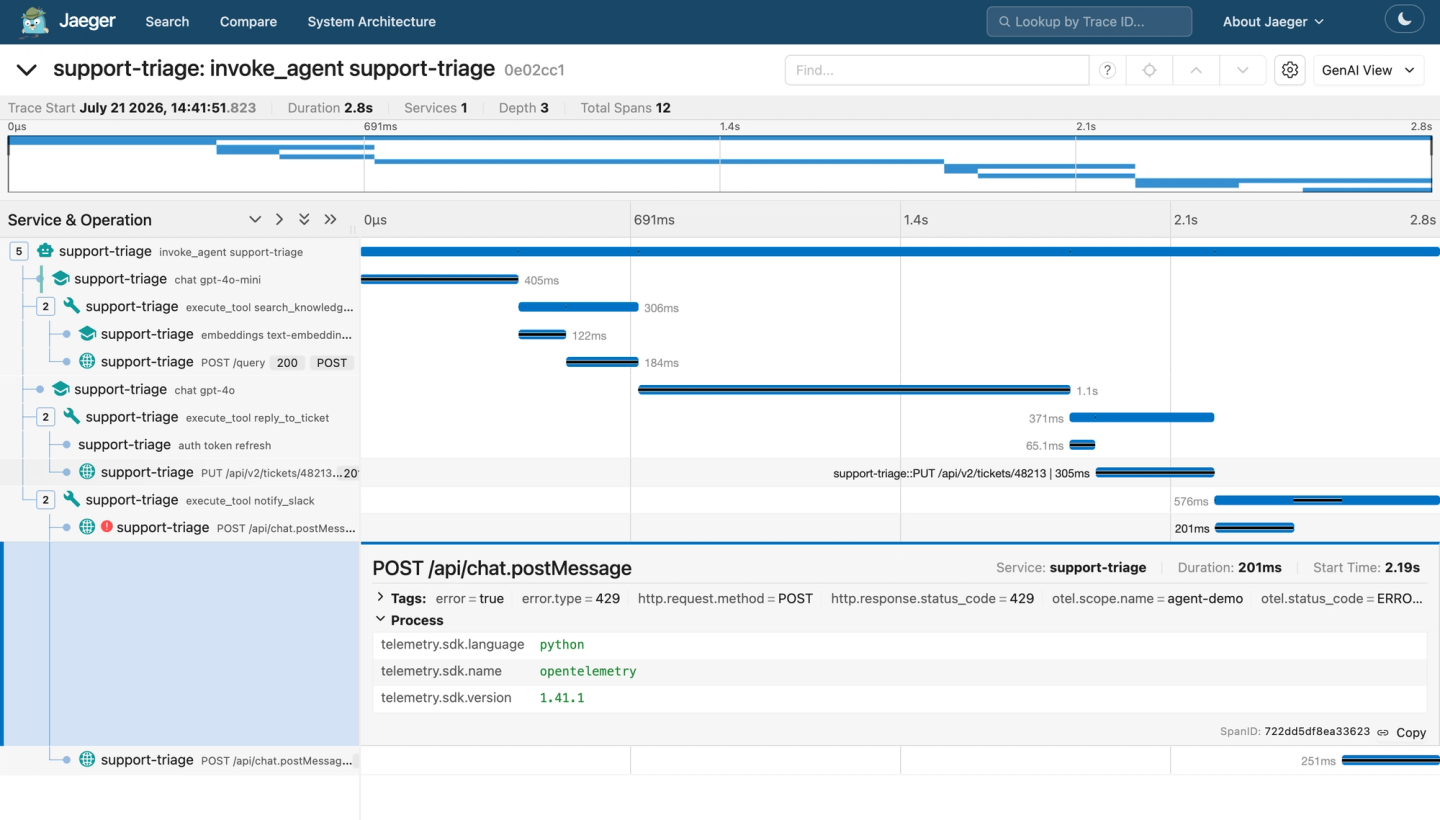
Here is a real agent run in Jaeger, an open-source OpenTelemetry backend, with the failed Slack call expanded. The integration span carries what the tool span cannot: http.response.status_code and error.type are both 429 on the POST /api/chat.postMessage call under execute_tool. The tool span on its own would show only that notify_slack errored, not the rate limit underneath it.
Setting up a complete AI agent observability pipeline
A complete setup has two parts that feed the same observability backend:
- The model layer. Emit
invoke_agent,chat, andexecute_toolspans with the token and model attributes above. Open-source instrumentation libraries such as OpenLLMetry, OpenInference, and OpenLIT do this for common agent frameworks, and some SDKs (for example the Vercel AI SDK) emit OpenTelemetry spans directly. - The integration layer. Emit HTTP, auth, and retry spans for the real API calls your tools make, as children of
execute_tool, and propagate the W3C trace context so they share one trace ID. You can do this per provider yourself, or run tool calls through a platform that already exports it. - Send both to one backend. Your instrumentation can export straight to an OpenTelemetry-compatible backend (Grafana, Datadog, Honeycomb), or through an OpenTelemetry Collector when you want one place to batch, sample, and route. Where you propagate trace context yourself (step 2), the model and integration spans join into one trace. Telemetry from a separate platform arrives as its own traces in the same backend, correlated by connection and time.
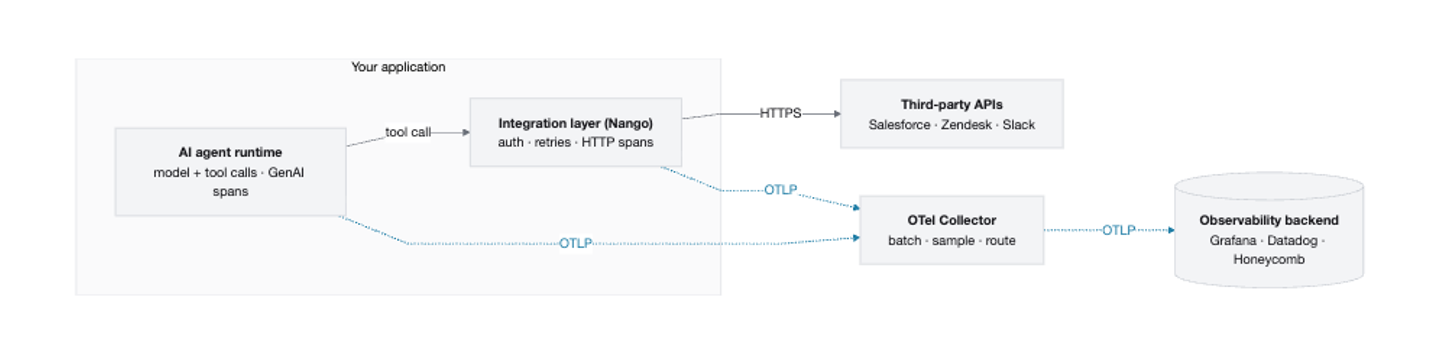
For the integration half, Nango gives you that telemetry without instrumenting each provider yourself. Nango enables AI agents to connect to 1,000+ APIs and 7,000+ pre-built, customizable tools. It is also open source. Every tool call runs through one layer that handles auth, retries, and the third-party request. All of it is captured in one place. Your agent calls a tool over REST with nango.triggerAction(...) or through Nango’s built-in MCP server at https://api.nango.dev/mcp, holding only a connection ID, never the provider credentials.
Nango exports that activity as OpenTelemetry traces for four kinds of operation: sync executions, action executions (your tool calls), third-party API webhook executions, and proxied requests. In Environment Settings, set the OpenTelemetry endpoint of your collector and any headers it needs:
OpenTelemetry endpoint:  https://my.otlp.collector:4318
Headers (optional):      Authorization: Bearer <collector-token>
From then on, every sync, action, webhook, and proxied request is exported as a trace you can query alongside the rest of your telemetry. In the dashboard, the same data shows up as per-execution logs, with each action, sync, and webhook run attributed to the connection it belongs to, filterable by integration, connection, or status:
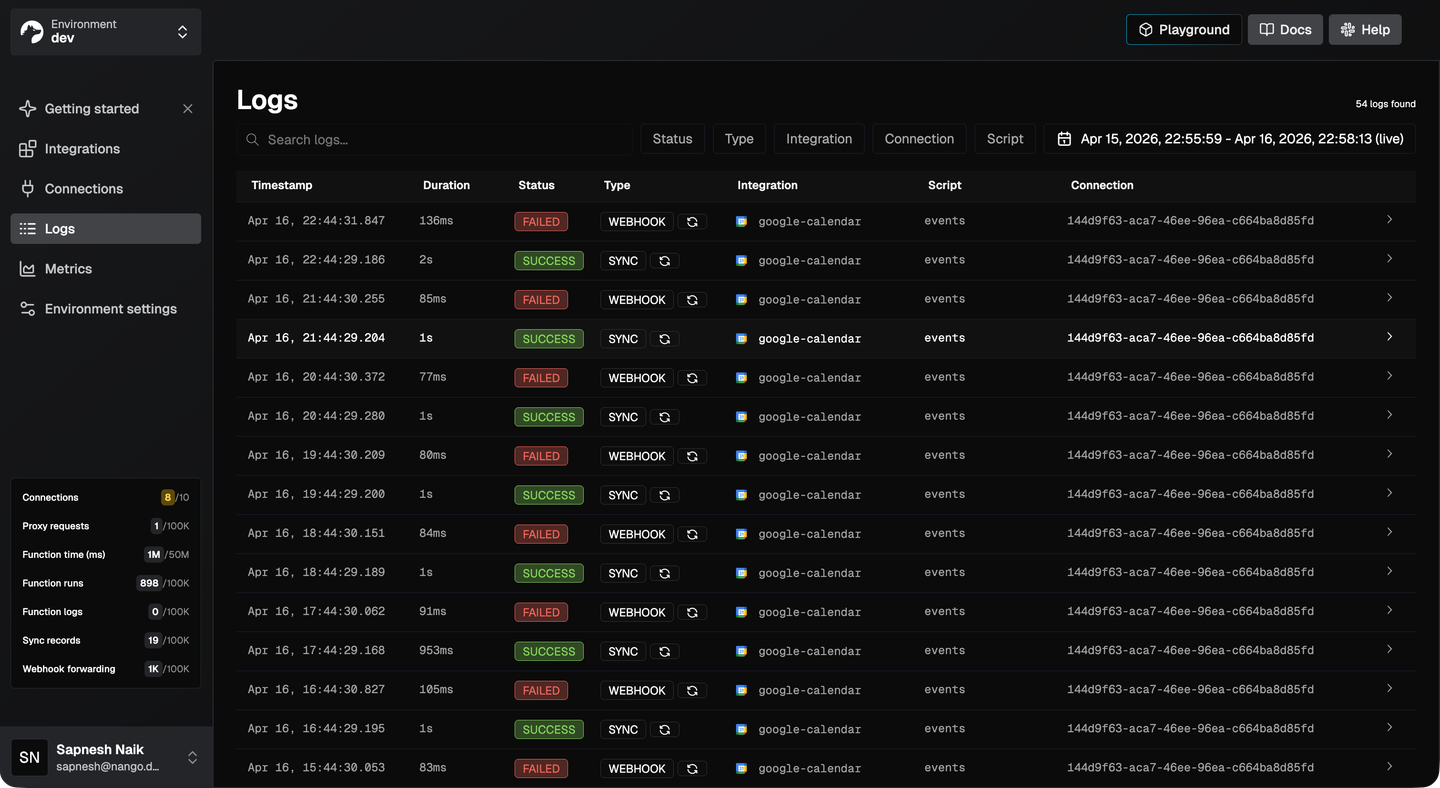
Open a single execution and you get the request and response detail for the third-party call, the same information the exported trace carries into your backend.
This runs alongside whatever model-layer instrumentation you already have. Nango does not replace your model-layer tracing; it covers the integration layer the GenAI conventions leave open, and both export to the same backend, so you can see the model-layer and integration-layer telemetry for a run side by side.
Frequently asked questions
Does OpenTelemetry support AI agents?
Yes. The OpenTelemetry GenAI semantic conventions define standard spans for agents, including invoke_agent for a full run, chat for model calls, and execute_tool for tool calls, plus attributes for the model, token usage, and tool names. The conventions are at Development stability, so names can still change. They cover the model and tool-selection layer, and you add integration-layer spans for what a tool does after it is called.
What can I actually see with OpenTelemetry for an AI agent?
Per run, you see the model and provider used, input and output token counts (your cost), which tools the agent selected, and each tool’s duration and error status. Prompts and tool arguments are off by default for privacy and are opt-in. To also see the API calls the tools make, you add HTTP and auth spans at the integration layer.
How do I trace MCP tool calls?
Instrument the tool-execution path so each call emits an execute_tool span, then add child spans for the API request, auth, and retries underneath it. If your tools run on a platform like Nango, tool calls are action-function executions that Nango already exports as OpenTelemetry traces and shows in per-connection logs, so you get the tool span and the integration spans without instrumenting each provider yourself.
How do I monitor the third-party API calls my agent makes?
Trace them at the layer where the call happens, not at the model layer. Attach spans for the outbound HTTP request, auth or token refresh, and any retries as children of the execute_tool span, using the standard OpenTelemetry HTTP attributes so they share one trace. A runtime that already proxies these calls, such as Nango, exports them for you across action executions, proxied requests, syncs, and webhooks, each tagged to the connection whose credentials were used.
Why does my agent retry the same tool call over and over?
Usually because the tool is failing in the integration layer and the model cannot see why. The common cause is an expired or revoked OAuth token: the call fails auth, the agent gets a generic error, and it retries the same call, spending latency and tokens each time. An integration-layer trace shows the invalid_grant on the token-refresh span, so you see the cause instead of inferring it. Rate-limit responses cause the same pattern.
Conclusion
OpenTelemetry is an open standard with broad backend support, so you trace your agent with the same tooling you use for the rest of your services instead of adopting a separate agent-only tool. The GenAI conventions give agent runs a portable shape (invoke_agent, chat, execute_tool) with model, token, and error data you can act on today.
For AI agents specifically, the observability needs to be at the API-integration layer, where the standard conventions stop and where most production incidents happen. Keep OpenTelemetry as the backbone and extend the trace with integration-layer events, so you can follow one agent run from the prompt to the real API call. You can build that layer per provider, or run tool calls through a platform like Nango that exports it as OpenTelemetry traces into your backend.
Related reading:


