Observability is critical when dealing with external systems. Today, we're excited to announce OpenTelemetry Observability for Nango, making it easier than ever to monitor and debug your integrations in real-time.
Extensive logging
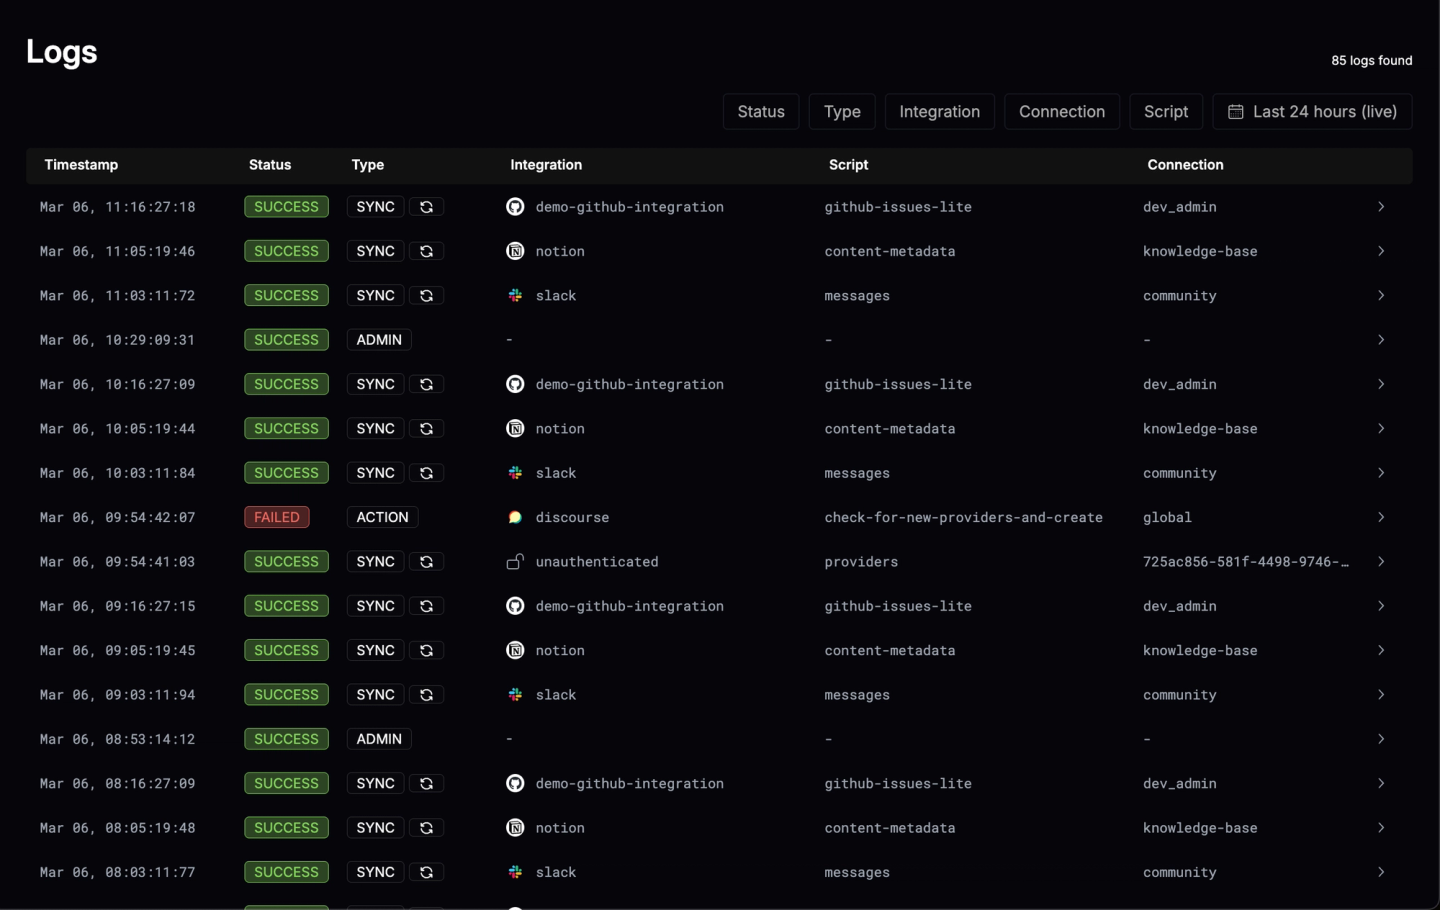
Nango’s logs now cover 18 different log types, updating in real-time. Logs can be filtered by:
- Status
- Integration
- Connection
- Scripts
- Time window
We're also improving logging soon with full-text search for even faster debugging.
Under the hood, ElasticSearch powers our logs and metrics, ensuring they remain fast and scalable as your integrations grow.
Real-time metrics
Nango now provides real-time metrics directly in the UI. You can track key execution data, including:
- Sync executions
- Action executions
- Proxy requests
- Webhook executions

We're also planning to add even more insights soon, such as authorization attempt tracking and breakdowns by connection, API, and integration.
OpenTelemetry export
For teams that need custom observability, we're introducing OpenTelemetry export. This feature enables exporting integration events as traces to your OpenTelemetry collector, providing deep insights into integration performance.
Supported events
The following integration events are currently exported:
- Sync executions
- Action executions
- Third-party API webhook executions
- Proxied requests
Check out the documentation to get started with OpenTelemetry export.
Why this matters
When working with external APIs, you don’t control the external system, making observability essential.
With Nango's observability features, you can:
- Break down metrics per customer or integration
- Debug API calls with detailed HTTP request logs
- Track data quality issues, ensuring correct data formatting
How to use it
- Use the Nango UI for a built-in observability experience.
- Use OpenTelemetry export for custom dashboards & alerting by ingesting logs into your preferred observability tool.
These features are available on both Nango Cloud and Nango Enterprise Self-Hosted.
Looking ahead
We’re committed to expanding observability features even further, adding more breakdowns, search capabilities, and deeper integration insights.
Let us know what you think and want to see next!