> ## Documentation Index
> Fetch the complete documentation index at: https://nango.dev/docs/llms.txt
> Use this file to discover all available pages before exploring further.
# Observability
> How Nango helps you with observability for your integrations
Nango's logs are comprehensive and give you a detailed picture of what happens in your integrations.
## Our approach
Since integrations rely on third-party APIs, production issues are bound to happen.
When you encounter a problem, great observability is the difference between a week-long needle-in-a-haystack hunt and a timely resolution.
We built Nango's logs based on three principles:
* **Comprehensive**: Everything that happens in Nango for your integrations produces an "operation" in the logs
* **Detailed**: Every operation and every log message contains detailed information about the integration, [connection](/guides/auth/auth-guide#overview), and [function](/guides/functions/functions-guide). Error messages are as detailed as the external APIs allow.
* **Customizable**: You can easily log your own messages from functions you write ([learn more](/reference/functions/functions-sdk#logging)). To consume logs, you can either use our built-in interface or export them with our [OpenTelemetry exporter](#opentelemetry-export)
## Overview of Nango logs
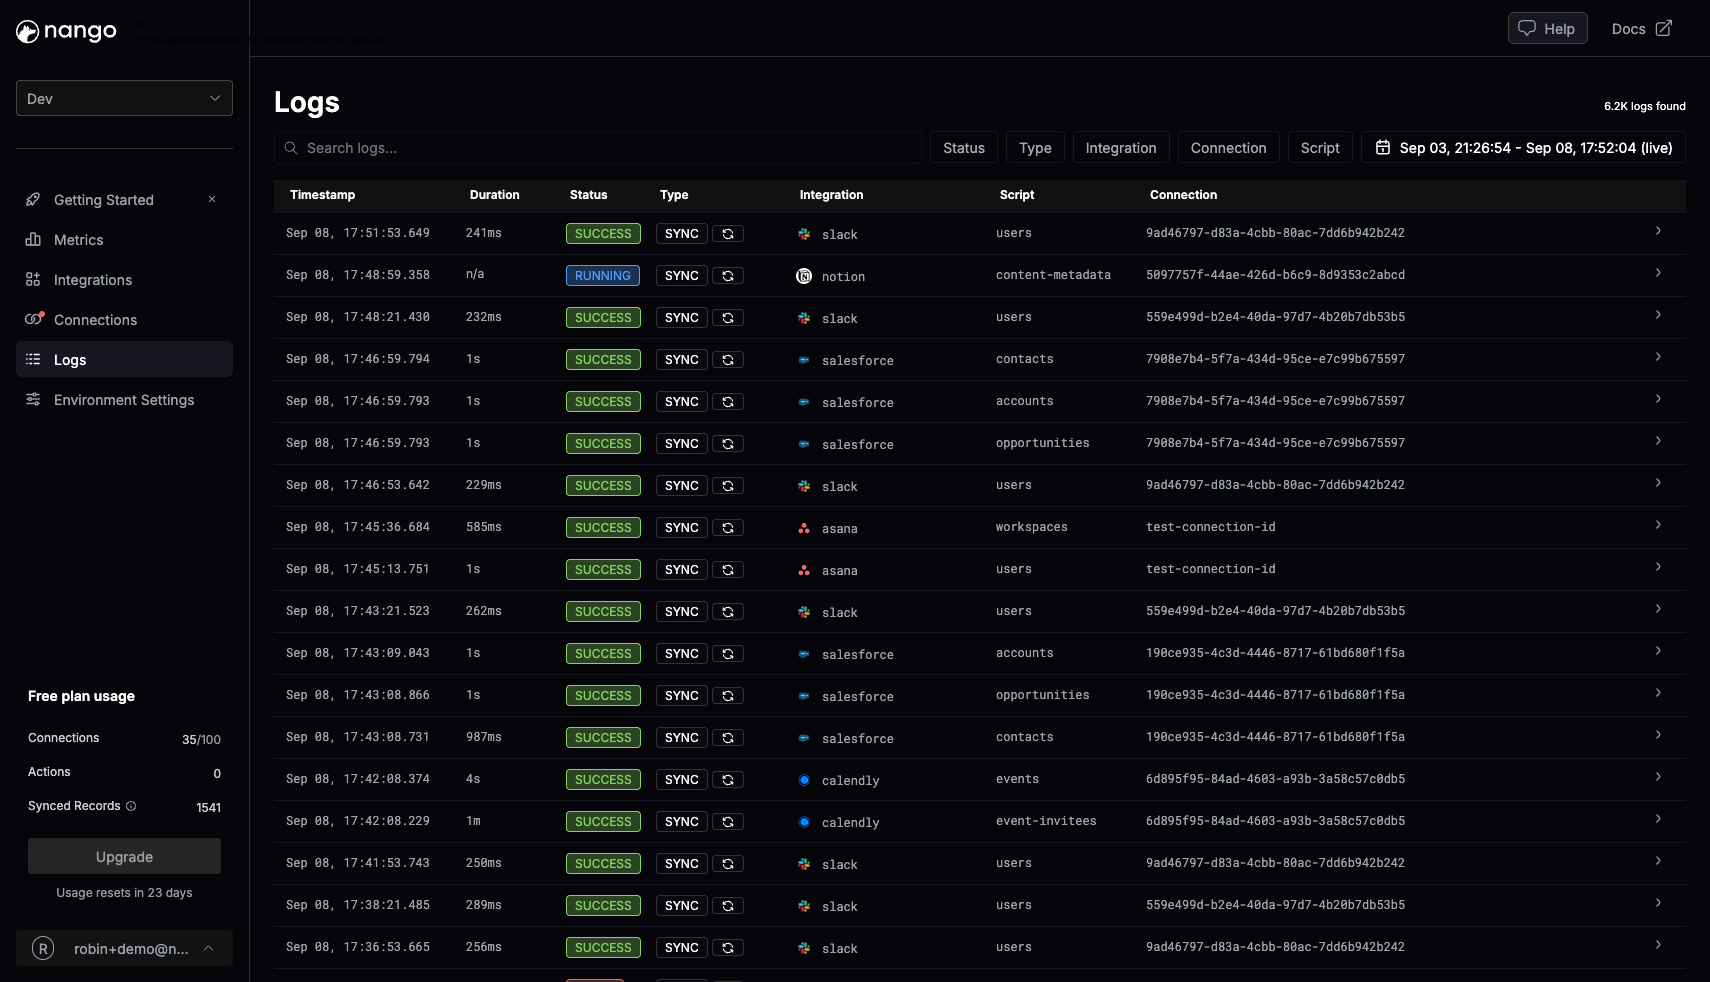 Logs are structured into:
* Operations: High-level actions happening in your Nango account (e.g., sync executed, connection created, webhook processed)
* Log messages: Nested in operations, these provide details on what happened (e.g., HTTP request executed, data validation warning, custom log message)
Nango provides detailed filtering and searching of log messages by integration, connection, operation type, status, etc.
We recommend exploring the logs in your own Nango account under **Logs**.
## OpenTelemetry export
Nango supports exporting OpenTelemetry traces so you can monitor and analyze integration activity in your own observability stack.
Use this for:
* Advanced custom metrics
* Advanced alerting and escalation paths (e.g., segment sync errors by customer account for customized escalation paths)
### Supported operations
The following operations are exported as traces:
* Sync executions
* Action executions
* Third-party API webhook executions
* Proxied requests
If you need support for other operations please reach out. We can enable support for them.
### Configuration
Log into the Nango dashboard and navigate to the Environment settings page.
In the Environment Settings, provide the following information:
* OpenTelemetry endpoint: The endpoint URL of your OpenTelemetry collector. Ex: [https://my.otlp.collector:4318](https://my.otlp.collector:4318)
* Headers (Optional): Any authorization headers or additional headers required to access your collector.
## Related guides
* [Function logging](/guides/functions/logging) - add custom logs from function code.
* [Webhooks from Nango](/guides/platform/webhooks-from-nango#webhook-retries-debugging) - debug webhook delivery.
* [Common issues](/guides/platform/common-issues) - troubleshoot failed auth, sync, and proxy operations.
Logs are structured into:
* Operations: High-level actions happening in your Nango account (e.g., sync executed, connection created, webhook processed)
* Log messages: Nested in operations, these provide details on what happened (e.g., HTTP request executed, data validation warning, custom log message)
Nango provides detailed filtering and searching of log messages by integration, connection, operation type, status, etc.
We recommend exploring the logs in your own Nango account under **Logs**.
## OpenTelemetry export
Nango supports exporting OpenTelemetry traces so you can monitor and analyze integration activity in your own observability stack.
Use this for:
* Advanced custom metrics
* Advanced alerting and escalation paths (e.g., segment sync errors by customer account for customized escalation paths)
### Supported operations
The following operations are exported as traces:
* Sync executions
* Action executions
* Third-party API webhook executions
* Proxied requests
If you need support for other operations please reach out. We can enable support for them.
### Configuration
Log into the Nango dashboard and navigate to the Environment settings page.
In the Environment Settings, provide the following information:
* OpenTelemetry endpoint: The endpoint URL of your OpenTelemetry collector. Ex: [https://my.otlp.collector:4318](https://my.otlp.collector:4318)
* Headers (Optional): Any authorization headers or additional headers required to access your collector.
## Related guides
* [Function logging](/guides/functions/logging) - add custom logs from function code.
* [Webhooks from Nango](/guides/platform/webhooks-from-nango#webhook-retries-debugging) - debug webhook delivery.
* [Common issues](/guides/platform/common-issues) - troubleshoot failed auth, sync, and proxy operations.